SaaS KPIs Derived Directly From Supabase Postgres
Materialize your SaaS KPIs directly in Postgres to keep analytics separate from production traffic.

Every meaningful SaaS KPI already has its raw material sitting in Supabase Postgres before anyone writes a line of analytics code. Subscription states, billing events, user records, feature usage, and plan transitions live there by default, a direct result of how Supabase is built: auth, storage, real-time, and edge functions all wrap around a single Postgres core. No team decides to centralize its operational data this way. It falls out of the architecture the moment a product ships on Supabase, because the write path for every user action, every subscription change, and every billing event already terminates in the same database.
The architectural consequence follows immediately. If the source of truth already sits in Postgres, pulling it out to compute KPIs somewhere else creates a second copy of the truth, one that can drift from the original, break in transit, or quietly diverge in how a metric gets defined. A founder who has shipped a product on Supabase has, without any additional engineering, already accumulated a structured, consistent record of the business. Getting the data is not the question; what matters is whether to compute KPIs where the data already lives or to introduce a second system that has to be kept in sync with it. That second option is where most of the risk in SaaS analytics infrastructure originates, and it sets up the real tension this article works through: production Postgres holds the truth, but production Postgres is also the system an application depends on to stay fast.
Running analytics queries directly on production Postgres is the wrong answer
The instinct to just query production Postgres for KPIs points in the right direction and executes badly. Analytics workloads scan large row sets, join across tables, and aggregate over long time windows, placing load on the exact system an application needs for fast transactional reads and writes. A dashboard query that touches a year of billing events competes for the same CPU, IO, and connection slots as a customer trying to check out.
This tradeoff is measurable. The Supabase Metrics API exposes a wide set of Postgres performance and health series, including CPU, IO, WAL activity, connection counts, and query statistics, through a Prometheus-compatible endpoint. Any Prometheus-compatible observability stack, Grafana, Datadog, Elastic, or a vendor-agnostic Prometheus setup, can scrape that endpoint and alert on saturation before an analytics query turns into a production incident. Teams running heavy reporting queries directly against their transactional database can watch, in those same metrics, the exact moment a KPI calculation starts competing with checkout traffic for IO bandwidth.
None of this argues for abandoning Postgres as the source of truth. It argues for computing KPIs at a safe distance from live traffic, so the single source of truth stays intact while the operational database keeps serving the application at the speed it was built for. That distance is a Postgres pattern in its own right, not a separate analytics system, and it is the subject of the next section.
Materialized views as the native Postgres pattern for safe KPI computation
The materialized view is the strongest Postgres-native answer to that tension. It is a pre-computed, indexed table that can be refreshed on a schedule rather than recalculated on every request, which turns a multi-second aggregation query into a millisecond read. For a SaaS dashboard tracking MRR charts, usage analytics, or team activity summaries, that difference separates a dashboard that competes with production traffic from one that simply serves numbers that were already calculated.
Building one starts with defining the metric as a named SQL object: active subscriptions by plan, MRR by cohort, whatever the business needs, written once and reviewed like any other piece of code. That object can be refreshed in two ways. A full refresh recalculates the entire view from scratch, simple but increasingly expensive as data grows. An incremental refresh, available through the pg_ivm extension, updates only the rows affected by recent changes rather than recomputing everything, keeping refresh costs proportional to what actually changed. Choosing between them, and choosing how often to refresh at all, is itself a governance decision: not every metric needs to be current to the minute, and deciding on a ten-minute refresh for MRR versus a daily refresh for a Rule of 40 calculation is a deliberate tradeoff between freshness and query cost, not an afterthought.
The side benefit compounds over time. SQL views are versionable, reviewable, and portable in a way dashboard configurations never are. A founder who later hires a database engineer or a data analyst hands that person a legible, auditable data model, not a pile of dashboard settings that only make sense to whoever built them.
The computational ceiling on this approach has also moved. Supabase's developer update credits Hydra's work on pg_duckdb, co-developed by Hydra, MotherDuck, DuckDB Labs, and other contributors, for dramatically accelerating analytics queries on Postgres. For most early-stage SaaS data volumes, that kind of speedup means serious analytical computation is now realistic inside Postgres itself, without standing up a separate data warehouse. What used to be a hard architectural choice, Postgres for transactions and a dedicated warehouse for analytics, has become, for a large share of SaaS companies, a single-system decision.
How SaaS KPIs map to Postgres patterns
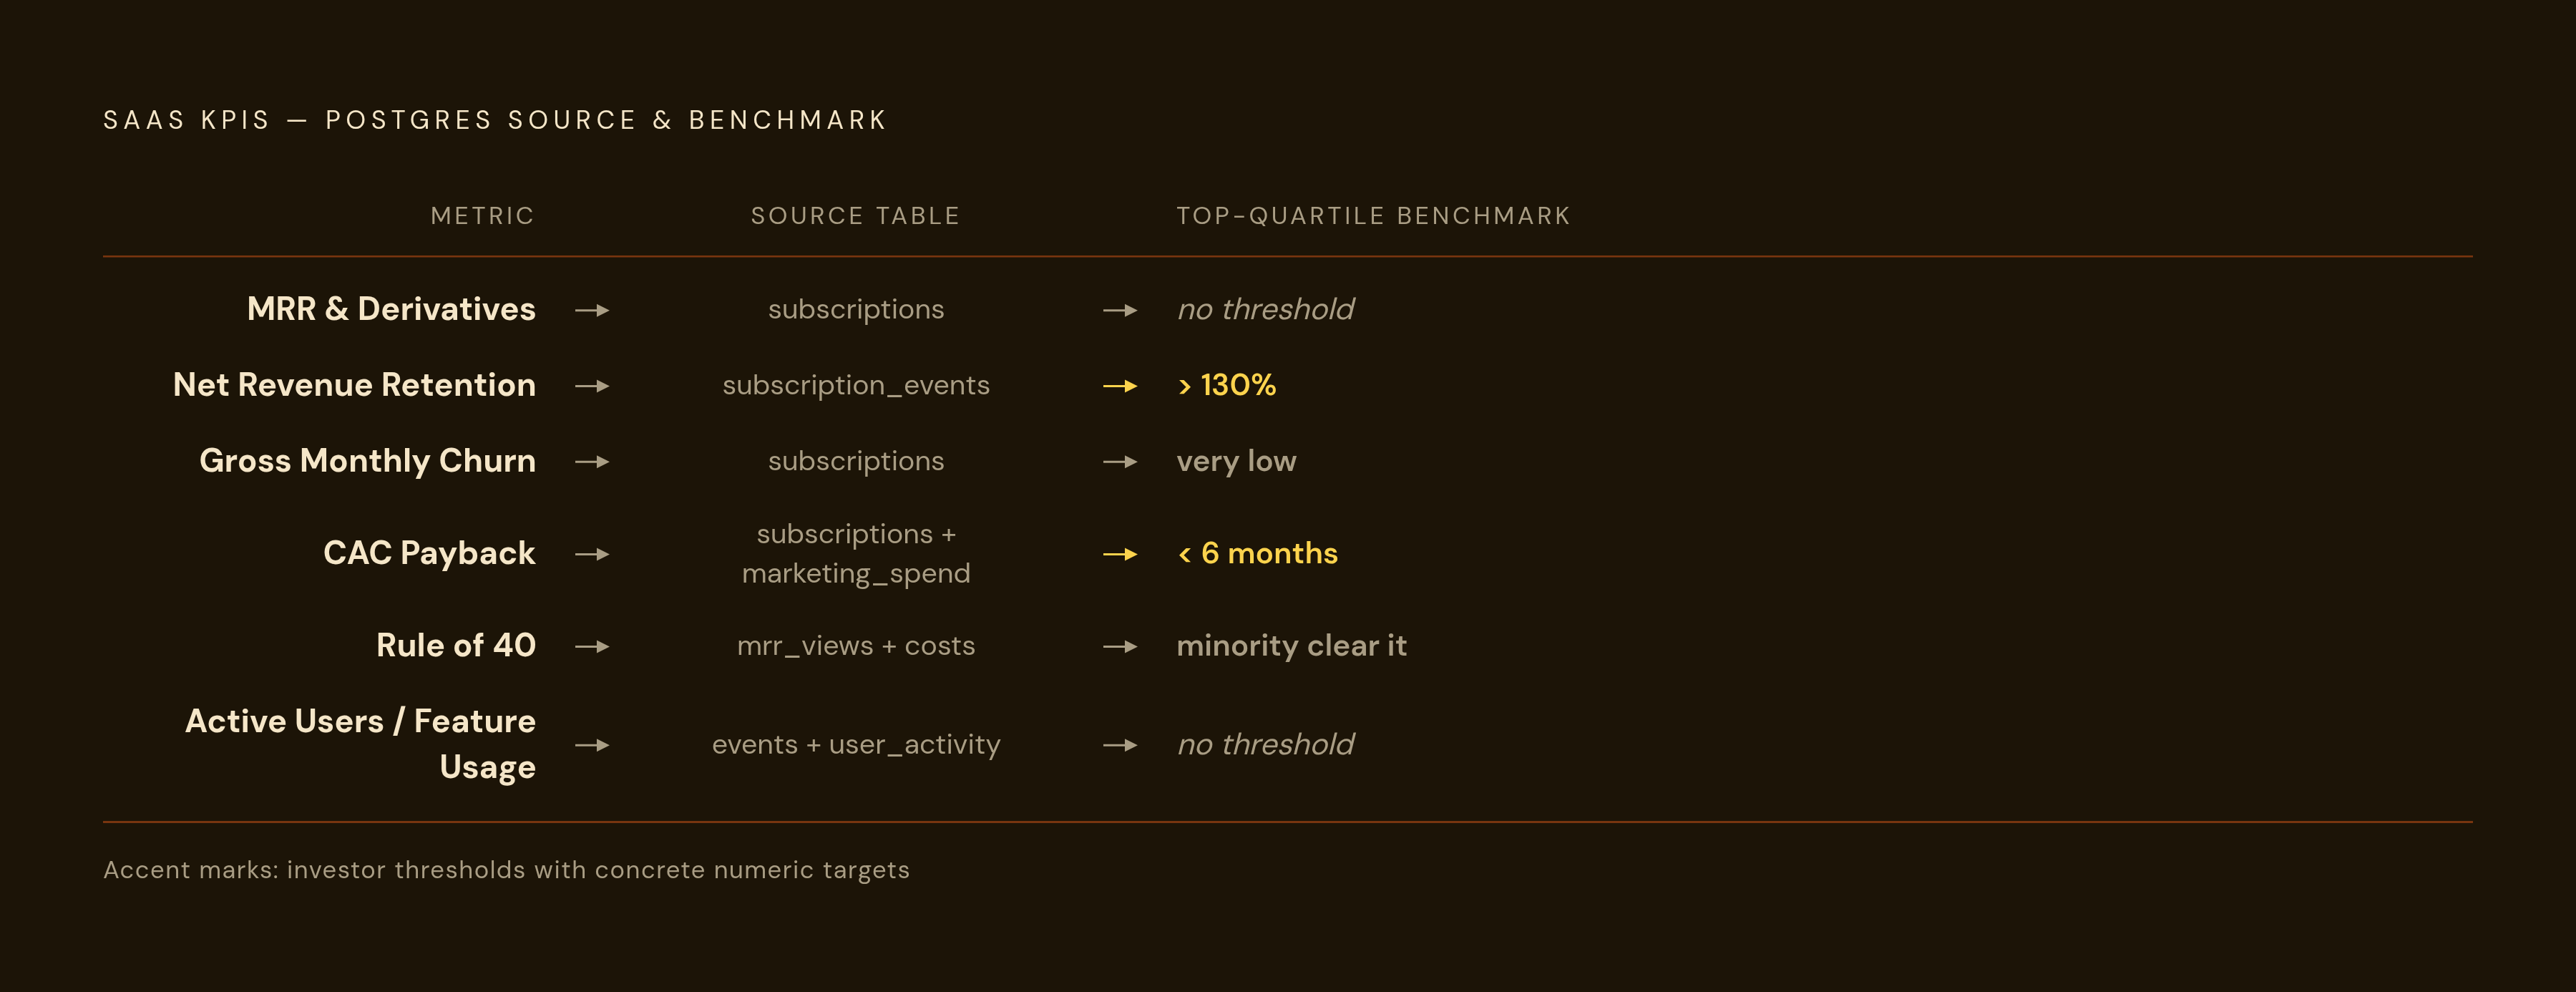
The KPIs that matter most to SaaS founders and investors map directly onto data that already exists in a Supabase Postgres schema. Codifying each one as a named materialized view is, in effect, building the data model for the business.
Monthly Recurring Revenue and its derivatives start from a subscriptions table carrying plan, status, amount, and billing interval columns, the standard output of a Stripe integration. From that table, a materialized view can derive MRR by normalizing annual plans to a monthly figure, new MRR from subscriptions created in the current period, expansion MRR from plan upgrades, contraction MRR from downgrades, and churned MRR from cancellations. The view itself aggregates by billing period start, groups by plan, and joins to a plans table for the amount, giving every downstream consumer the same number because there is only one place that number gets computed.
Net Revenue Retention requires a view of subscription state changes over time, either a point-in-time snapshot or a subscription_events log table recording every transition a customer's plan goes through. The modeling approach compares MRR from a cohort at month 0 against that same cohort's MRR at month 12, accounting for expansion, contraction, and churn along the way. NRR above 130% is the top quartile of SaaS performance, and the metric matters because it tells an investor, independent of any new sales, whether the existing customer base is expanding or shrinking.
Gross Monthly Churn draws from the same subscriptions table, filtered to a cancelled_at timestamp or a status field set to canceled, grouped by the month cancellation occurred. Top-quartile companies hold this number very low, and it requires no external tooling at all: the entire calculation lives inside the subscriptions table already populated by the billing integration.
Customer Acquisition Cost and CAC Payback need one additional input the rest of these metrics do not: a costs table, or a manually maintained marketing_spend table, joined to new customer counts by cohort. Top-quartile CAC payback comes in under 6 months. The only external dependency this metric introduces is spend data, and that data can be written into Postgres manually or through a simple integration, which keeps the entire computation inside one system rather than splitting it across a spreadsheet and a database.
Rule of 40 combines ARR growth rate, derivable from the same MRR views already built for revenue reporting, with profit margin, which requires a costs table or burn data. Companies that score well on the Rule of 40 see meaningfully higher valuations, and only a minority of SaaS companies clear even the basic threshold, making it a genuine differentiator. It functions as investor shorthand for whether a business fundamentally works, and like every other metric here, it is computable from the same Postgres schema without a separate calculation layer.
Active Users and Feature Usage draw from an events or user_activity table that Supabase's real-time and edge function infrastructure populates as a natural byproduct of the application running. Supabase's Logs & Analytics feature, built on Logflare, processes billions of log events daily and supports SQL queries through Logflare Endpoints. Usage signal from the API gateway and edge functions can be queried and materialized right alongside revenue and retention metrics, in the same database, under the same governance.
How distributed metric definitions create metric drift
The default founder stack scatters the same metric across tools with no single authoritative definition of any of them: Stripe for revenue truth, a product analytics tool for usage signal, Notion for the board memo, Slack for alerts, a spreadsheet for the board deck. Each tool slices time windows differently, applies its own exclusions, and defines terms like "active user" or "churn" according to its own internal logic.
Metric drift results. One person in the organization reports a churn figure meaningfully lower than another's, and both are technically correct according to the tool each one pulled from. The cost of that drift is concrete: it erodes trust in the numbers across the company, prompts investors to ask which figure is the real one, and burns meeting time reconciling spreadsheets instead of deciding what to do about the number once everyone agrees on it.
A named materialized view removes the ambiguity at its root. Because the metric is computed in exactly one place, everyone who queries that view gets the same answer, whether they are a founder preparing a board deck, an investor running diligence, or an engineer debugging a dashboard. That single definition, with one source and one owner, functions as a data dictionary in practice. It also carries forward the legibility advantage already built into the materialized view approach: the SQL is versionable and reviewable, so a future hire can read the definition directly instead of depending on someone walking them through it.
Naming, governing, and exposing Postgres-backed metrics for teams and AI agents
Trustworthy Postgres-native metrics need three governance properties in place. Named definitions mean every metric exists as a view with a documented, agreed-upon SQL definition. Access controls mean the analytics layer is read-only and isolated from the production write path, so a query against a metric can never touch the data an application depends on to function. Freshness guarantees mean each view carries a known refresh schedule, so anyone consuming the number knows how current it actually is.
Naming the views well, mrr_by_plan_monthly, churn_rate_cohort, and so on, turns each one into a contract between whoever produces the data and whoever consumes it, whether that consumer is a person building a board deck or a system acting on its own. Row Level Security, which Supabase implements natively inside Postgres, enforces those access controls at the database layer itself rather than in application code that a bug or an oversight could bypass. A read-only analytics role can be granted access to the materialized views without ever touching the underlying transactional tables that power the application.
That same governance structure is what makes it safe to open these metrics up to AI agents, not just to people. The July 28, 2026 revision to the MCP specification makes the protocol stateless at the protocol layer, which lets MCP servers run as serverless functions that spin down to zero when idle. Exposing Postgres-backed metrics to an agent no longer requires standing up and paying for persistent infrastructure, putting it within reach of a two-person startup. The July 2026 MCP release candidate pairs that stateless core with an Extensions framework, Tasks, MCP Apps, authorization hardening, and a formal deprecation policy, giving the protocol the kind of stability a production governance layer requires.
The decision that matters most here is narrow and specific: expose only named metric objects through MCP, never raw SQL access. The same structure that stops one employee from reporting a different churn number than another is the structure that stops an agent from doing the same thing, or worse.
The risk of agents querying production Postgres directly
Agents should never query a transactional database directly to enrich context, and the reasoning is the same reasoning that rules out letting a dashboard hit production tables for every page load, only with higher stakes. An agent with raw SQL access to a Postgres instance can issue the same kind of expensive, unbounded aggregation query a human analyst might write by accident, except an agent can issue many of them in rapid succession, without a person in the loop noticing the load climbing before it affects customers.
Raw access also reopens the exact governance problem the named-view architecture was built to close. An agent that can write its own SQL against transactional tables can define "active user" or "monthly churn" however its prompt happens to lead it, producing a number that disagrees with the one the rest of the organization already trusts. That is metric drift generated at machine speed, compounding the same trust problem described earlier.
Restricting agents to named, governed metric objects through MCP closes both risks at once. The agent gets exactly the same number a founder would get pulling up the materialized view directly, computed on the same schedule, under the same access controls enforced by Row Level Security at the database layer. Production Postgres keeps serving the application at the speed it was built for, the metric layer keeps producing one authoritative number per KPI, and the only thing that changes is who, or what, is allowed to ask for it.